
在前一章中,我们已经学习了如何从头到尾地配置ELK堆栈。这样的配置能够支持大多数用例。然而,对于一个无限扩展的生产环境,瓶颈仍然存在:
- Logstash需要使用管道和过滤器处理日志,这需要花费大量的时间,如果日志爆发,可能会成为瓶颈;
- 弹性搜索需要对日志进行索引,这也消耗了时间,当日志爆发时,它就成为了一个瓶颈。
上面提到的瓶颈可以通过添加更多的Logstash部署和缩放Elasticsearch集群来平滑,当然,也可以通过在中间引入缓存层来平滑,就像所有其他的IT解决方案一样(比如在数据库访问路径的中间引入Redis)。利用缓存层最流行的解决方案之一是将Kafka集成到ELK堆栈中。我们将在本章讨论如何建立这样的环境。
架构
当Kafka被用作ELK栈中的缓存层时,将使用如下架构:
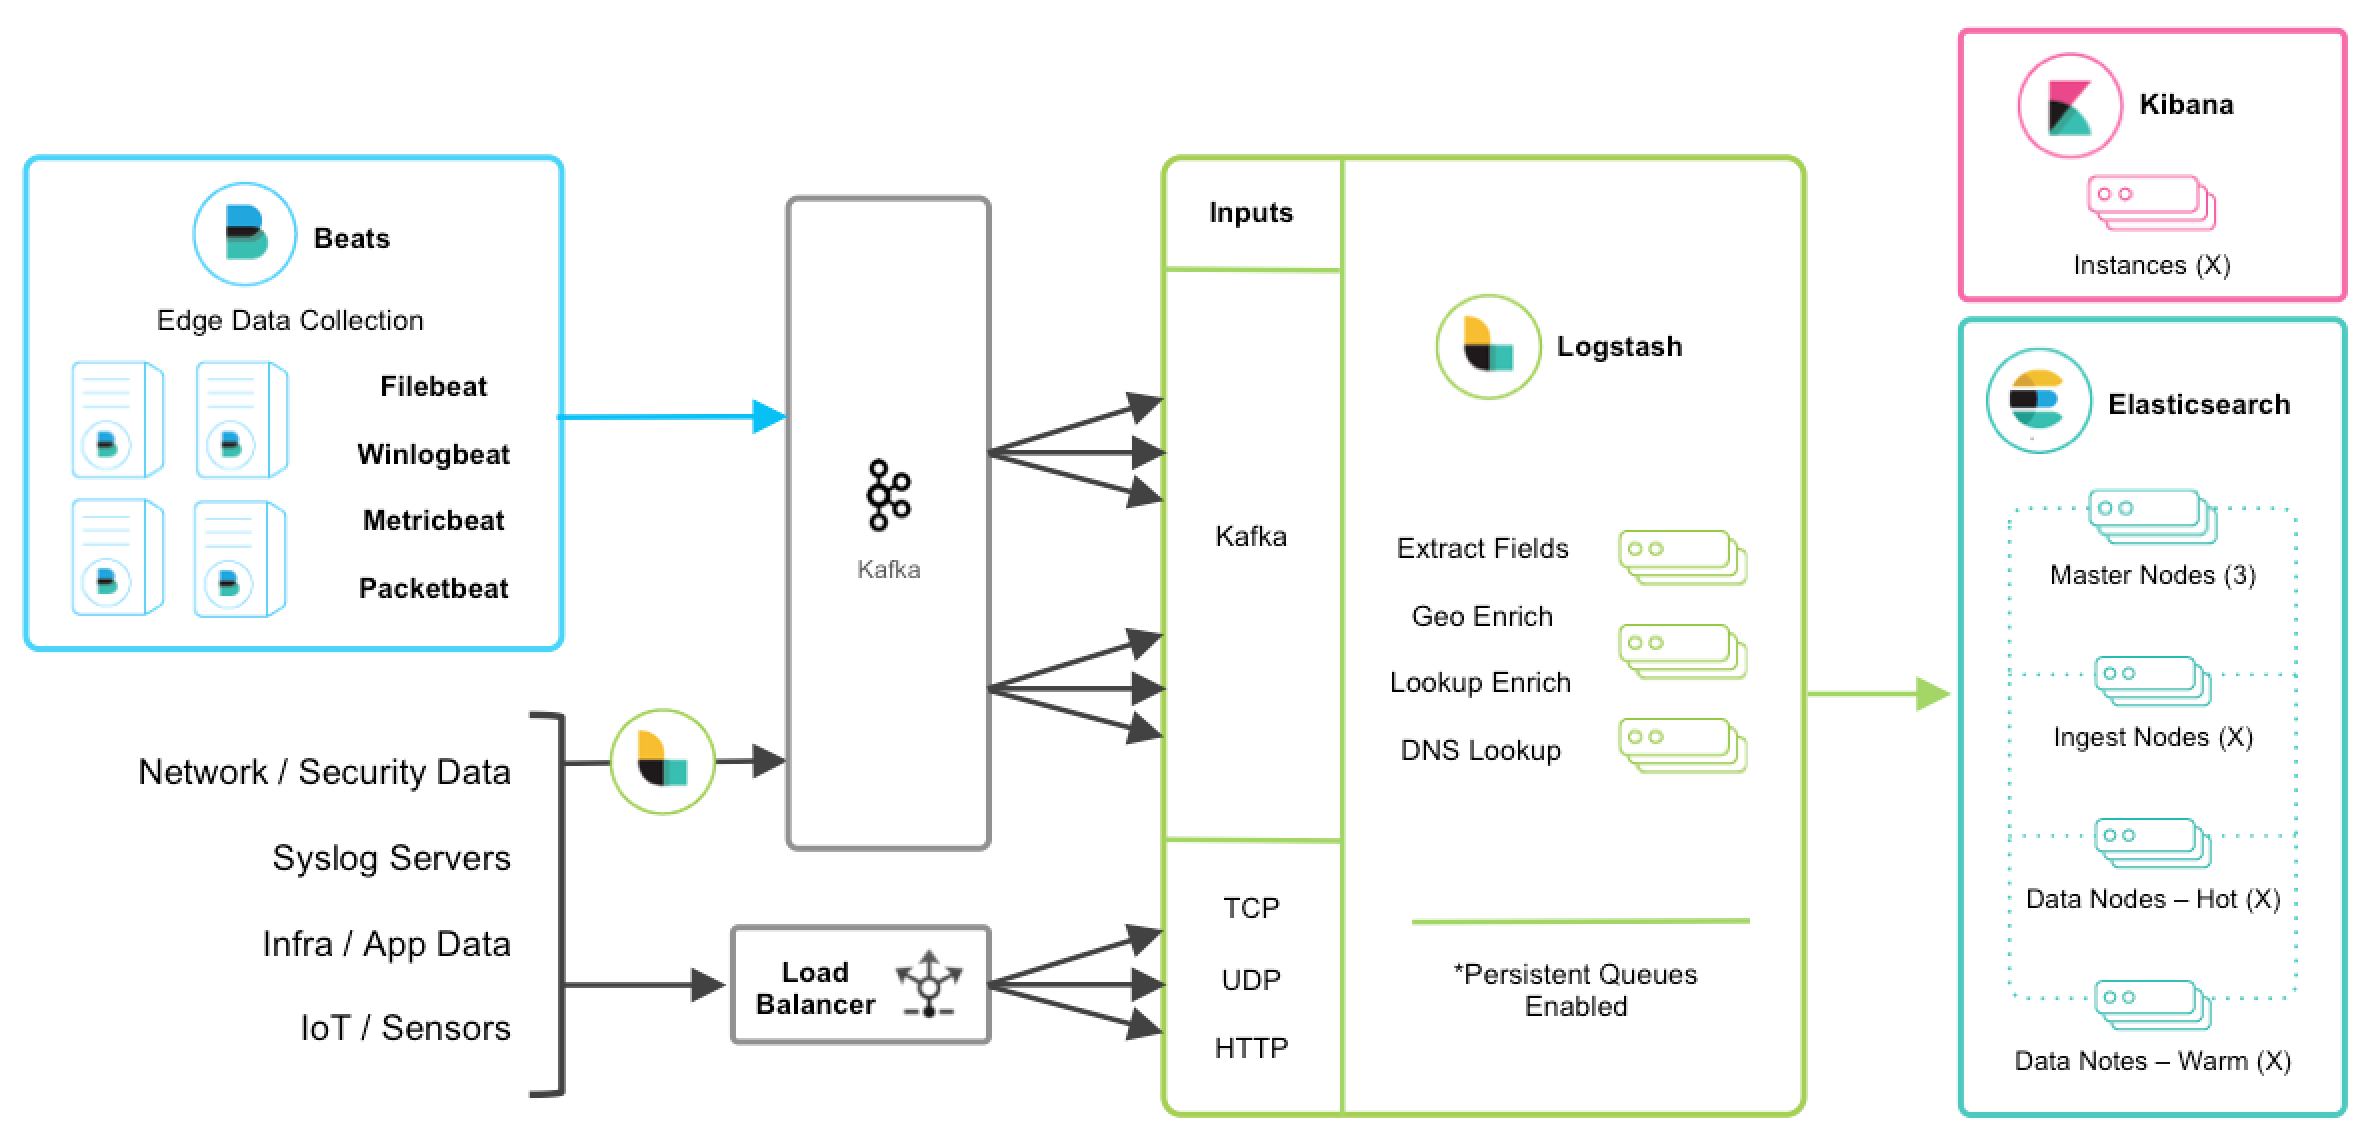
这方面的细节可以从部署和扩展Logstash中找到
演示环境
基于以上介绍的知识,我们的演示环境将构建如下:
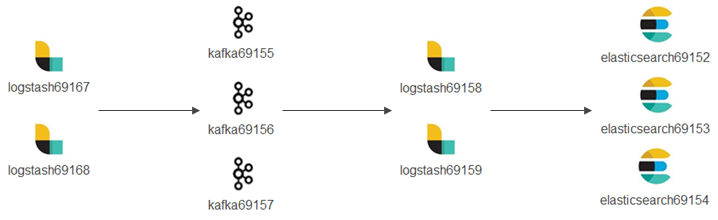
The detailed enviroment is as below:
- logstash69167/69168 (hostnames: e2e-l4-0690-167/168): receive logs from syslog, filebeat, etc. and forward/produce logs to Kafka topics;
- kafka69155/156/157 (hostnames: e2e-l4-0690-155/156/157): kafka cluster
- zookeeper will also be installed on these 3 x nodes;
- kafka manager will be installed on kafka69155;
- logstash69158/69159 (hostnames: e2e-l4-0690-158/159): consume logs from kafka topics, process logs with pipelines, and send logs to Elasticsearch;
- elasticsearch69152/69153/69154 (hostnames: e2e-l4-0690-152/153/154): Elasticsearch cluster
- Kibana will be installed on elasticsearch69152
- Data sources such as syslog, filebeat, etc. follow the same configuration as when Kafka is not used, hence we ignore their configuration in this chapter.
部署
Elasticsearch部署
安装过程已经由本文档记录,请参阅前面的章节。在本节中,我们将只列出配置和命令。
-
Install Elasticsearch on elasticsearch69152/69153/69154;
-
Configs on each node (/etc/elasticsearch/elasticsearch.yml):
-
elasticsearch69152
cluster.name: edc-elasticsearch
node.name: e2e-l4-0690-152
path.data: /var/lib/elasticsearch
path.logs: /var/log/elasticsearch
network.host: 0.0.0.0
discovery.seed_hosts: ["e2e-l4-0690-152", "e2e-l4-0690-153", "e2e-l4-0690-154"]
cluster.initial_master_nodes: ["e2e-l4-0690-152", "e2e-l4-0690-153", "e2e-l4-0690-154"]
-
elasticsearch69153
cluster.name: edc-elasticsearch
node.name: e2e-l4-0690-153
path.data: /var/lib/elasticsearch
path.logs: /var/log/elasticsearch
network.host: 0.0.0.0
discovery.seed_hosts: ["e2e-l4-0690-152", "e2e-l4-0690-153", "e2e-l4-0690-154"]
cluster.initial_master_nodes: ["e2e-l4-0690-152", "e2e-l4-0690-153", "e2e-l4-0690-154"]
-
elasticsearch69154
cluster.name: edc-elasticsearch
node.name: e2e-l4-0690-154
path.data: /var/lib/elasticsearch
path.logs: /var/log/elasticsearch
network.host: 0.0.0.0
discovery.seed_hosts: ["e2e-l4-0690-152", "e2e-l4-0690-153", "e2e-l4-0690-154"]
cluster.initial_master_nodes: ["e2e-l4-0690-152", "e2e-l4-0690-153", "e2e-l4-0690-154"]
-
-
Start Elasticsearch service on each node:
systemctl disable firewalld
systemctl enable elasticsearch
systemctl start elasticsearch
-
Verify (on any node): 3 x alive nodes should exist and one master node is elected successfully
[root@e2e-l4-0690-152]# curl -XGET 'http://localhost:9200/_cluster/state?pretty'
Kibana部署
安装过程已经由本文档记录,请参阅前面的章节。在本节中,我们将只列出配置和命令。
-
Install Kibana on elasticsearch69152;
-
Configure Kibana(/etc/kibana/kibana.yml):
server.host: "0.0.0.0"
server.name: "e2e-l4-0690-152"
elasticsearch.hosts: ["http://e2e-l4-0690-152:9200", "http://e2e-l4-0690-153:9200", "http://e2e-l4-0690-154:9200"]
-
Start the service on each node:
systemctl enable kibana
systemctl start kibana
-
Verify: access http://10.226.69.152:5601 to verify that Kibana is up and running.
Zookeeper 部署
Zookeeper is a must before running a Kafka cluster. For demonstration purpose, we deploy a Zookeeper cluster on the same nodes as the Kafka cluster, A.K.A kafka69155/69156/69157.
-
There is no need to do any installation, decompressing the package is enough;
-
Configure zookeeper on each node(conf/zoo.cfg):
tickTime=2000
initLimit=10
syncLimit=5
dataDir=/var/lib/zookeeper
clientPort=2181

server.1=10.226.69.155:2888:3888
server.2=10.226.69.156:2888:3888
server.3=10.226.69.157:2888:3888
-
Create file /var/lib/zookeeper/myid with content 1/2/3 on each node:
echo 1 > /var/lib/zookeeper/myid # kafka69155
echo 2 > /var/lib/zookeeper/myid # kafka69156
echo 3 > /var/lib/zookeeper/myid # kafka69157
-
Start Zookeeper on all nodes:
./bin/zkServer.sh start
./bin/zkServer.sh status
-
Connect to Zooper for verification:
./bin/zkCli.sh -server 10.226.69.155:2181,10.226.69.156:2181,10.226.69.157:2181
Kafka 部署
A Kafka cluster will be deployed on kafka69155/69156/69157.
-
Kafka does not need any installation, downloading and decompressing a tarball is enough. Please refer to Kafka Quickstart for reference;
-
The Kafka cluster will run on kafka69155/156/157 where a Zookeeper cluster is already running. To enable the Kafka cluster, configure each node as below(config/server.properties):
-
kafka69155:
broker.id=0
listeners=PLAINTEXT://0.0.0.0:9092
advertised.listeners=PLAINTEXT://10.226.69.155:9092
zookeeper.connect=10.226.69.155:2181,10.226.69.156:2181:10.226.69.157:2181
-
kafka69156:
broker.id=1
listeners=PLAINTEXT://0.0.0.0:9092
advertised.listeners=PLAINTEXT://10.226.69.156:9092
zookeeper.connect=10.226.69.155:2181,10.226.69.156:2181:10.226.69.157:2181
-
kafka69157:
broker.id=1
listeners=PLAINTEXT://0.0.0.0:9092
advertised.listeners=PLAINTEXT://10.226.69.157:9092
zookeeper.connect=10.226.69.155:2181,10.226.69.156:2181:10.226.69.157:2181
-
-
Start Kafka on all nodes:
./bin/kafka-server-start.sh -daemon config/server.properties
Once the Kafka cluster is running, we can go ahead configuring Logstash. When it is required to make changes to the Kafka cluster, we should shut down the cluster gracefully as below, then make changes and start the cluster again:
./bin/kafka-server-stop.sh
Kafka Manager 部署
可以使用CLI命令管理Kafka集群。然而,它并不是非常方便。Kafka Manager是一个基于web的工具,它使基本的Kafka管理任务变得简单明了。该工具目前由雅虎维护,并已被重新命名为CMAK (Apache Kafka的集群管理)。无论如何,我们更喜欢称之为Kafka经理。
The Kafka manager will be deployed on kafka69155.
-
Download the application from its github repo;
-
After decompressing the package, change the zookeeper option as below in conf/application.conf:
kafka-manager.zkhosts="e2e-l4-0690-155:2181,e2e-l4-0690-156:2181,e2e-l4-0690-157:2181"
-
Create the app deployment(a zip file will be created):
./sbt clean dist
-
Unzip the newly created zip file (kafka-manager-2.0.0.2.zip in this demo) and start the service:
unzip kafka-manager-2.0.0.2.zip
cd kafka-manager-2.0.0.2
bin/kafka-manager
-
The Kafka manager can be accessed from http://10.226.69.155:9000/ after a while;
-
Click Cluster->Add Cluster and enter below information to manage our Kafka cluster:
- Cluster Name: assign a meaningful name for this cluster
- Cluster Zookeeper Hosts: 10.226.69.155:2181,10.226.69.156:2181,10.226.69.157:2181
- Enable JMX Polling: yes
-
Done.
Logstash部署
基于我们对演示环境的介绍,我们有两套Logstash部署:
-
Log Producers: logstash69167/69168
Collect logs from data sources (such as syslog, filebeat, etc.) and forward log entries to corresponding Kafka topics. The num. of such Logstash instances can be determined based on the amount of data generated by data sources.
Actually, such Logstash instances are separated from each other. In other words, they work as standalone instances and have no knowledge on others.
-
Log Consumers: logstash69158/69159
Consume logs from Kafka topics, modify logs based on pipeline definitions and ship modified logs to Elasticsearch.
Such Logstash instances have the identical pipeline configurations (except for client_id) and belong to the same Kafka consumer group which load balance each other.
The installation of Logstash has been covered in previous chapters, we won’t cover them again in this chapter, instead, we will focus our effort on the clarification of pipeline definitions when Kafka is leveraged in the middle.
Logstash产生日志到Kafka
每个Logstash实例负责合并某些指定数据源的日志。
- logstash69167: consolidate logs for storage arrays and application solutions based on Linux;
- logstash69168: consolidate logs for ethernet switches and application solutions based on Windows.
-
Define pipelines(/etc/logstash/conf.d)
-
logstash69167
# /etc/logstash/conf.d/ps_rhel.conf input { beats { port => 5045 tags => ["server", "filebeat", "ps", "rhel"] } } filter { mutate { rename => ["host", "server"] } } output { kafka { id => "ps-rhel" topic_id => "ps-rhel" codec => "json" bootstrap_servers => "10.226.69.155:9092,10.226.69.156:9092,10.226.69.157:9092" } } # /etc/logstash/conf.d/sc_sles.conf input { beats { port => 5044 tags => ["server", "filebeat", "sc", "sles"] } } filter { mutate { rename => ["host", "server"] } } output { kafka { id => "sc-sles" topic_id => "sc-sles" codec => "json" bootstrap_servers => "10.226.69.155:9092,10.226.69.156:9092,10.226.69.157:9092" } } # /etc/logstash/conf.d/pssc.conf input { udp { port => 514 tags => ["array", "syslog", "sc", "ps"] } } output { kafka { id => "pssc" topic_id => "pssc" codec => "json" bootstrap_servers => "10.226.69.155:9092,10.226.69.156:9092,10.226.69.157:9092" } } # /etc/logstash/conf.d/unity.conf input { udp { port => 5000 tags => ["array", "syslog", "unity"] } } output { kafka { id => "unity" topic_id => "unity" codec => "json" bootstrap_servers => "10.226.69.155:9092,10.226.69.156:9092,10.226.69.157:9092" } } # /etc/logstash/conf.d/xio.conf input { udp { port => 5002 tags => ["array", "syslog", "xio"] } } output { kafka { id => "xio" topic_id => "xio" codec => "json" bootstrap_servers => "10.226.69.155:9092,10.226.69.156:9092,10.226.69.157:9092" } } -
logstash69168
# /etc/logstash/conf.d/ethernet_switch.conf
input {
  udp {
    port => 514
    tags => ["switch", "syslog", "network", "ethernet"]
  }
}

output {
  kafka {
    id => "ether-switch"
    topic_id => "ether-switch"
    codec => "json"
    bootstrap_servers => "10.226.69.155:9092,10.226.69.156:9092,10.226.69.157:9092"
  }
}

# /etc/logstash/conf.d/vnx_exchange.conf
input {
  beats {
    port => 5044
    tags => ["server", "winlogbeat", "vnx", "windows", "exchange"]
  }
}

filter {
  mutate {
    rename => ["host", "server"]
  }
}

output {
  kafka {
    id => "vnx-exchange"
    topic_id => "vnx-exchange"
    codec => "json"
    bootstrap_servers => "10.226.69.155:9092,10.226.69.156:9092,10.226.69.157:9092"
  }
}

# /etc/logstash/conf.d/vnx_mssql.conf
input {
  beats {
    port => 5045
    tags => ["server", "winlogbeat", "vnx", "windows", "mssql"]
  }
}

filter {
  mutate {
    rename => ["host", "server"]
  }
}

output {
  kafka {
    id => "vnx-mssql"
    topic_id => "vnx-mssql"
    codec => "json"
    bootstrap_servers => "10.226.69.155:9092,10.226.69.156:9092,10.226.69.157:9092"
  }
}
-
-
Enable pipelines (/etc/logstash/pipelines.yml):
-
logstash69167:
- pipeline.id: ps_rhel
  path.config: "/etc/logstash/conf.d/ps_rhel.conf"
- pipeline.id: sc_sles
  path.config: "/etc/logstash/conf.d/sc_sles.conf"
- pipeline.id: pssc
  path.config: "/etc/logstash/conf.d/pssc.conf"
- pipeline.id: unity
  path.config: "/etc/logstash/conf.d/unity.conf"
- pipeline.id: xio
  path.config: "/etc/logstash/conf.d/xio.conf"
-
logstash69168:
- pipeline.id: ethernet_switch
  path.config: "/etc/logstash/conf.d/ethernet_switch.conf"
- pipeline.id: vnx_exchange
  path.config: "/etc/logstash/conf.d/vnx_exchange.conf"
- pipeline.id: vnx_mssql
  path.config: "/etc/logstash/conf.d/vnx_mssql.conf"
-
-
Start Logstash servers on all nodes:
systemctl start logstash
-
Verify topics are successfully created on Kafka:
ssh root@kafka69155/156/157
./bin/kafka-topics.sh -bootstrap-server "10.226.69.155:9092,10.226.69.156:9092,10.226.69.157:9092" --list
-
Verify logs are sent to Kafka successfully:
ssh root@kafka69155/156/157
./bin/kafka-console-consumer.sh -bootstrap-server "10.226.69.155:9092,10.226.69.156:9092,10.226.69.157:9092" --topic <topic name>
现在,我们已经将Logstash实例配置为Kafka producer。在继续之前,有必要介绍一些关于使用Kafka作为输出插件时的管道配置的技巧。
不要为这类Logstash实例的管道定义复杂的过滤器,因为它们可能增加延迟;
- 在输入部分添加标签,以简化Kibana的日志搜索/分类工作;
- 为不同的管道指定不同的id和有意义的名称;
- 如果syslog也是设置中的数据源,则将主机字段重命名为其他有意义的名称。关于这个问题的解释,请参考tips章节。
Logstash,它消耗来自Kafka的日志
我们将为logstash69158/69159配置管道。这两个Logstash实例具有相同的管道定义(除了client_id之外),并通过利用Kafka的消费者组特性均匀地使用来自Kafka主题的消息。
由于日志被安全地缓存在Kafka中,所以在将日志实体发送到Elasticsearch之前,使用管道定义复杂的过滤器来修改日志实体是正确的。这不会导致瓶颈,因为Kafka中已经有日志了,唯一的影响是您可能需要等待一段时间才能看到Elasticsearch/Kibana中的日志。如果查看来自Elasticsearch/Kibana的日志对时间很敏感,那么可以添加属于同一使用者组的更多Logstash实例来平衡处理的负载。
-
Define pipelines(/etc/logstash/conf.d): client_id should always be set with different values
# /etc/logstash/conf.d/kafka_array.conf input { kafka { client_id => "logstash69158-array" # client_id => "logstash69159-array" group_id => "logstash-array" topics => ["unity", "vnx", "xio", "pssc", "powerstore"] codec => "json" bootstrap_servers => "10.226.69.155:9092,10.226.69.156:9092,10.226.69.157:9092" } } output { elasticsearch { hosts => ["http://e2e-l4-0690-152:9200", "http://e2e-l4-0690-153:9200", "http://e2e-l4-0690-154:9200"] index => "edc-storage-%{+YYYY.MM.dd}" } } # /etc/logstash/conf.d/kafka_server.conf input { kafka { client_id => "logstash69158-server" # client_id => "logstash69159-server" group_id => "logstash-server" topics => ["sc-sles", "ps-rhel", "vnx-exchange", "vnx-mssql"] codec => "json" bootstrap_servers => "10.226.69.155:9092,10.226.69.156:9092,10.226.69.157:9092" } } output { elasticsearch { hosts => ["http://e2e-l4-0690-152:9200", "http://e2e-l4-0690-153:9200", "http://e2e-l4-0690-154:9200"] index => "edc-server-%{+YYYY.MM.dd}" } } # /etc/logstash/conf.d/kafka_switch.conf input { kafka { client_id => "logstash69158-switch" # client_id => "logstash69159-switch" group_id => "logstash-switch" topics => ["ether-switch"] codec => "json" bootstrap_servers => "10.226.69.155:9092,10.226.69.156:9092,10.226.69.157:9092" } } output { elasticsearch { hosts => ["http://e2e-l4-0690-152:9200", "http://e2e-l4-0690-153:9200", "http://e2e-l4-0690-154:9200"] index => "edc-ethernet-%{+YYYY.MM.dd}" } } -
Enable pipelines on all nodes(/etc/logstash/pipelines.yml):
- pipeline.id: kafka_array
  path.config: "/etc/logstash/conf.d/kafka_array.conf"
- pipeline.id: kafka_server
  path.config: "/etc/logstash/conf.d/kafka_server.conf"
- pipeline.id: kafka_switch
  path.config: "/etc/logstash/conf.d/kafka_switch.conf"
-
Start logstash on all nodes:
systemctl start logstash
配置并启动Logstash之后,日志应该能够发送到Elasticsearch,并可以从Kibana检查。
现在,我们已经将Logstash实例配置为Kafka使用者。在继续之前,有必要介绍一些在使用Kafka作为输入插件时的管道配置技巧。
- 对于不同Logstash实例上的每个管道,应该始终使用不同的值设置client_id。该字段用于识别Kafka上的消费者;
- 对于不同Logstsh实例上的相同管道,group_id应该设置恒等值。这个字段用于标识Kafka上的消费者组,如果值不同,负载平衡就无法工作。
数据源配置
数据源是服务器、交换机、阵列等,它们通过beat、syslog等将日志发送到Logstash。配置它们的步骤与没有Kafka集成时相同,请参照前一章。
结论
我们已经配置了一个集成了Kafka和ELK堆栈的演示环境。通过集成Kafka,可以提高日志处理性能(添加缓存层),还可以集成更多潜在的应用程序(使用来自Kafka的日志消息并执行一些特殊操作,如ML)。
原文:https://elastic-stack.readthedocs.io/en/latest/e2e_kafkapractices.html
本文:http://jiagoushi.pro/node/1135
讨论:请加入知识星球【首席架构师圈】或者微信小号【jiagoushi_pro】